Showing posts with label Fundamental Analysis. Show all posts

Dec 1, 2013

Attention Book Value Investor!!

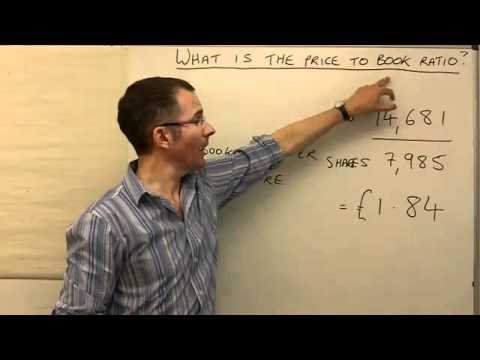
Book value gets a lot of attention these days - perhaps because it's such an easy number to find. You see it reported everywhere. With current technology, u can google and it can generate a number of stocks that traded below its book value. In theory, u just buy a stock that has a higher book value versus its price. Example, book value per share RM8.00 versus stock price RM4.00. Before I start going into book value, let's us understand what is book value. The formula is pretty simple:
Pb ratio

How it is used among investors? It compare share price against book value per share. The ratio measures how far share price against its book value. Assuming A stock priced at RM15.00 versus its book value RM3.00 per share. It is said that the stock is traded at market 5 times against its book value. It may be considered at Overvalued stock, not a buy criteria. or the other way around, stock that is sell 0.5 time than its book value, can be considered as undervalued stock. Similarly, the NTA (net tangible asset) which has similar behavior.

The drawback of this method is that, the stated book value often bears little relationship to the actual worth of the company. It sometimes doesn't reflect the true value (be it understates or overstates). For example, Penn Central had a book value of more than USD60.00 per share when it went bankrupt. In 1976, Alan Wood Steel had a stated book value of USD32 million (USD40 per share). However, the company filed for Chapter 11 Bankruptcy 6 months later (similar like Pn17). The problem was that its steel-making facility, worth perhaps USD30 million on paper, was ineptly planned and certain operational flaws rendered it practically useless. TO pay off some of the debt, the steel-plate mill was sold to Lukens Corp. at around USD5 million and the rest of the plant was presumably sold for scrap.

A textile company may have a warehouse full of fabric that nobody wants with book value USD4 a yard. In reality, they couldn't give the stuff away for 10 cents. There's another unwritten rule here, the closer you get to the a finished product, the less predictable the resale value. You know how much cotton is worth but who can be sure about,an orange cotton shirt? You know what you can get for a bar of metal but what is it worth as a floor lamp.

A few decades ago, Warren Buffett decided to shut down the New Bedford textile plant that was one of his earliest acquisitions. Management hoped to get something out of selling the loom machinery which has a book value of USD866,000. But at a public auction, looms that were purchased for USD5,000 each years back, now were sold at USD26. What was reported as book value of USD866,00 only brought in USD163,000 in actual cash.

Overvalued assets on the left side of the balance sheet are especially looked very suspicious when there's a lot of debt on the right side. A company may reported RM400 million in assets and RM300 million in debts, resulting in a positive book value of RM100 million. The debt part is a real number. but assets of RM400 million may be worth at RM200 million in a bankruptcy sale or auction, then the actual book value is a negative RM100 million. now, it has become a worthless company.

A piece of advice, when you buy a stock just because its book value, drill down the detail of what those values really are.

For more clarity, you may want to evaluate Warren Buffett recent acquisition: (1)Exxon Mobil (2) Heinz (3)IBM or even its current shareholding like Coca Cola (in Berkshire Hathaway).
Is he buying stock that value higher than its book value (5 times than price to book ratio) or lower than its book value (1 time than price to book ratio). Or, why isn't he selling Coca Cola if it is traded higher than its book value?
In summary, just be careful using a book value, or it can be a value trap!

Apr 27, 2013

How To Calculate A Stock Intrinsic Value


In the previous articles, we have covered on buying a stock that is below its market value. There are 1001 ways on how to define an intrinsic value of a stock. As you know, stock market price is fluctuated every now and then. You will never know at what price that market reflects a stock true value.

I will share on how to come out with intrinsic value. I may not be possible to cover all methods of the stock valuation in one article but will try to cover it as many as I can in the next series of articles.
Intrinsic Value Illustration

Just remember, calculating an intrinsic value is not an exact science. It is a projection or estimation on the future value of a stock price based on business historical performance. What determine a future value is subject to a lot of factors, variables and parameters:
  • Business performance - can a company sustain its current performance in the next 10 years?
  • Business trend - Will the trend change? (best classic example, Nokia used to be a leader in Cellular phone  but it has been knocked down once Apple Inc.  introduce Iphone. Now Apple Inc. faced the same cycle where Samsung has slowly become No.1 in Smart Phone Industry)
  • Economic condition (country, regional and global)
  • Company's financial condition (debt, cash flow, Earning, future expansion and capital expenditure etc)
  • Talented CEO or Board of directors
For the above criteria, you need to be really conservative in your stock valuation. One of the stock investor legend (Benjamin Graham and Seth Klarman), they factor in the so-called Margin of Safety (MOS). On the other hand, coming out with Stock Intrinsic Value, it is an estimation. Famous saying by Warren Buffett, "It is better to be approximately right than precisely wrong." An intrinsic value of a stock will give a hint or gut feeling whether a stock value can be undervalued or overvalued.

Why do we bother to find an intrinsic value? Here's the reason why. Assuming a company's earning growth 15% on yearly basis. Current Earning is RM100 million. Next 10 years, if a company accumulated RM100 million every year, by year 2023 company has accumulated RM1 billion. Next step is, in the next 10 years [2023], will the value of RM1.00 in 2023 be equivalent to RM1.00 in 2013. You never know what is the inflation rate like, interest rate, BLR rate etc. What do you need to do? You need to factor in Discounted rate.

Let's use a real company information and come out with intrinsic value. I choose Tomypak Holding Berhad.
Tomypak Counter
Tomypak Counter
In the previous article, I have shared where to find all the relevant information (http://zayedzulkifli.blogspot.com/2013/04/where-to-find-wtf-investment-tools.html). This will help you to estimate intrinsic value of a stock.
Tomypak Balance Sheet 2012

Tomypak Profit & Loss Statement
Tomypak Cash Flow Statement

Tomypak Cashflow Statement
Don't worry on how-to formula. I have developed excel sheet formula, you just need to plug-in:
  1. Current year net profit (from Profit & Loss statement)
  2. Total outstanding share in the market
  3. Cash and Equivalent (from Balance sheet statement)
  4. Total debt (From balance sheet statement)
  5. EPS growth rate is standardized though some investment analysts give 26% CAGR-3 years-EPS growth rate. (remember: be conservative)
Tomypak Intrinsic Value

Tomypak current market price as of last week was RM1.41. Comparing its intrinsic value RM3.04, our entry price should be at RM1.52 or below (the lower the better it is). So, does that mean when we buy RM1.41 we will immediately get RM3.04? It will take time for the market to realize tomypak market value. if lucky enough, we may see the realization in 2-3 years. To be successful in investing, you need to have 3P Persistent, Perseverance and Patience.
3P: Persistence, Perseverance and Patience

Some additional information on Tomypak. On top of margin of safety price, a dividend will be a safety net for your investment while waiting for market to realize a stock value. At least, you have passive income plus capital appreciation.
Tomypak EPS Historical

Tomypak Dividend History

Another factor to decide:
  • A company has been consistently and continuously paying dividends to stock holder
  • A company has recorded uninterrupted net profit for many years
  • A company's operating cash flow
  • Proven record on ROE (Return on Equity) that company has efficiently used capital and provide reward to shareholders.
  • Conservative debt management - net cash is preferred


Disclaimer: the above is just for education purpose. Not intended for buy or sell call.

Apr 20, 2013

Where To Find (WTF) Investment Tools


You must be wondering now: What stocks to buy? Do I just simply buy? What if I bought the right stocks? Matrix
What stocks to buy?
What stocks to buy?
To buy or sell stocks, it is a decision making. For you to make a decision, you must equip yourself with intelligent tools to back up your decision. Where to find (WTF) Investment tools that will assist your decision making in buying or selling stocks? You cannot rely on others on your decision. Your money is your responsible. You have to make due diligent analysis on your decision. Otherwise, you tend to blame others if you are making wrong decision.
Here, I will share intelligent data that may help you making intelligent decision
1. Information of companies listed in Bursa Malaysia: there are over 1000 companies listed in Bursa Malaysia. The first source to go is to go to Bursa Malaysia website itself:

For Muslims, if there are interested whether a company operates according to syariah, Securities Commission Malaysia provides such list which is updated twice a year:

2. Financial Data on Annual Report (Balance Sheet, Profit and Loss Statement, Cash flow): This information is very crucial in stock market decision making. You don't call yourself as an investor if you didn't look at any part of financial information of a company.
Same case as the above, Bursa Malaysia also provides financial data particularly on the annual report as well as quarterly report. Example is Dutch Lady Milk Industries:
Dutch Lady Milk Industries - Leader in Diary Product in Malaysia

Corporate Announcement on Dutch Lady Milk
Disadvantage of Bursa Malaysia Financial Data is that, it is just data. You have to interpret and do you financial ratio calculation (Like Return of Equity, Debt to Equity Ratio etc). It may be available in the annual reports still.

3. Financial Ratio Calculation:You can also find on other financial data and financial ratio on companies listed in Bursa Malaysia. You don't need to be mathematical genius or financial expert on how to do ratio calculation, what formula etc. This is given and free of charge:
DLADYM
 DLADYM
DLADYM

All of the above is free. There are a few companies that provide services giving financial data and ratio analysis:
http://klsenew.klsetracker.com.my/ (if you open trading account with Jupiter Securities or Apex Securities, they provide data from EquitiesTracker as well but limited to 5 years data)
EQ
https://www.insage.com.my (if you subscribe with Malacca Securities, they provide financial data from Insage with limited to 8 years of Financial Historical Data)
INSAGE

4. Financial Analysis on Companies: I really recommend you to buy (in fact, it is a must have for every investors in Malaysia. This book is available at MPH Bookstore, Popular Bookstore, Kinokuniya etc. It provides quite reasonable analysis. But you shouldn't follow blindly. The price of this is RM70.00. It is updated and published twice a year (March and September).
SPG
Stock Performance Guide Malaysia

Dynaquest
Sample Analysis in Stock Performance Guide

Looking forward your investment journey Big Boss

Apr 12, 2013

Investing School of Thoughts


There's a saying, "Tactic wins the battle, strategy wins the war"

images

To win the investment war, you need to strategize your investment approach. Else, you will have high chance of losing the money. There are 3 popular school of thoughts in investing strategy. There are many more but I just want to highlight 3 strategy that commonly used and successfully generate return as well. The three strategies are

1. Fundamental Analysis Strategy

Fundamentalist will look at the business fundamental, looking at quantitative value at  a report (Ratios, Financial reports like Balance sheet, Cash flow statement, Profit and loss etc) as well as qualitative characteristics of a business - moat, durability, management, business prospects etc.). The fundamentalist will try to buy and hold a stock as long as they can. the buy call will be triggered when a value of a stock is extremely undervalued using margin of safety valuation. The sell call will be executed if the business fundamental is deteriorated like increase of debt, consecutive losses, bankrupt, no durability. Best example in trendy and hot product like Polaroid Camera (now that it is being obsolete in the market), Nokia Handphone use to become market leader in 2000's, now being cannibalized when Apple and Samsung introduced smart phone.
Fundamental vs Technical
2. Technical Analysis Strategy

This strategy will only look at price and volume action. believe that the historical performance of stocks and markets are indications of future performance. This can be tracked using chart and graph. The technical analyst tend timing to buy entry and sell exit based on pattern of price and volume. They sometimes don't call themselves as investors but known as traders or chartists. Sample chart below is MYEG (Company listed in Bursa Malaysia who provides E-Government Services), the arrows are the trigger of buy and sell call. It is not holy grail as they said. Profitability of you being correct is 60-70%.
MYEG stock from the perspective of Technical Analyst

3. Hybrid of Both Strategies

The hybrid of both will only select strong fundamental companies to be traded when there's a buy or sell signal using price and volume action based on historical performance of chart pattern. Some said the hybrid can’t mix as both are opposed to each other like oil and water. The hybrid uses most important reports and ratios like Profit & Loss (earning report), P/E (Price Earning Ratio). Mostly, the hybrid will not try to keep a stock for a long term. Most popular strategy that people talk a lot is CANSLIM Method invented by William O' Neil (Will discuss separately on this in different topics).
Which one should be your choice?
Which one fits your investment objective, time frame, your psychological mind, your full time job etc. Both can be right or wrong. If you think you can consistently make money with either strategies; stick to it, be discipline, have perseverance, patience and may the success be always be with you.

My take (personal bias): is the one who stay in the market the longest and become successful of all time like Warren Buffett, John Neff, Benjamin Graham, Philip Fisher, Peter Lynch, John Templeton (just t0 name a few). Of course, some successful trader like Dan Zanger,  Richard Dennis, William Eckhardt etc. The question is who can sustain longer in the market and becoming more richer. If you look at the Forbes top billionaire, who are they?